Seismic stations around the Pacific Rim recorded seismograms of the March 11, 2011 earthquake in Japan. The data from three seismic stations is presented below; Taoyuan in Taiwan, Wanagama in Indonesia, and the Wild Horse Valley in Oregon, USA.
- Click here to see the location of the three seismic stations.
Each seismic station actually recorded three seismograms for the earthquake event. These seismograms represent motion in the East-West direction, the North-South direction, and in the vertical direction. Earthquakes are recorded in all three directions since the originating earthquake can send out seismic waves in many directions. With seismograms for three different directions you can be reasonably sure that at least one, if not more, of those directions will result in a good seismic wave trace as the earthquake passes by. Analyze the data from the three seismic stations in order to determine the origin of the earthquake.
Note: Refer to lesson E3: The Strength of Earthquakes for background information on calculating the location of an earthquake.
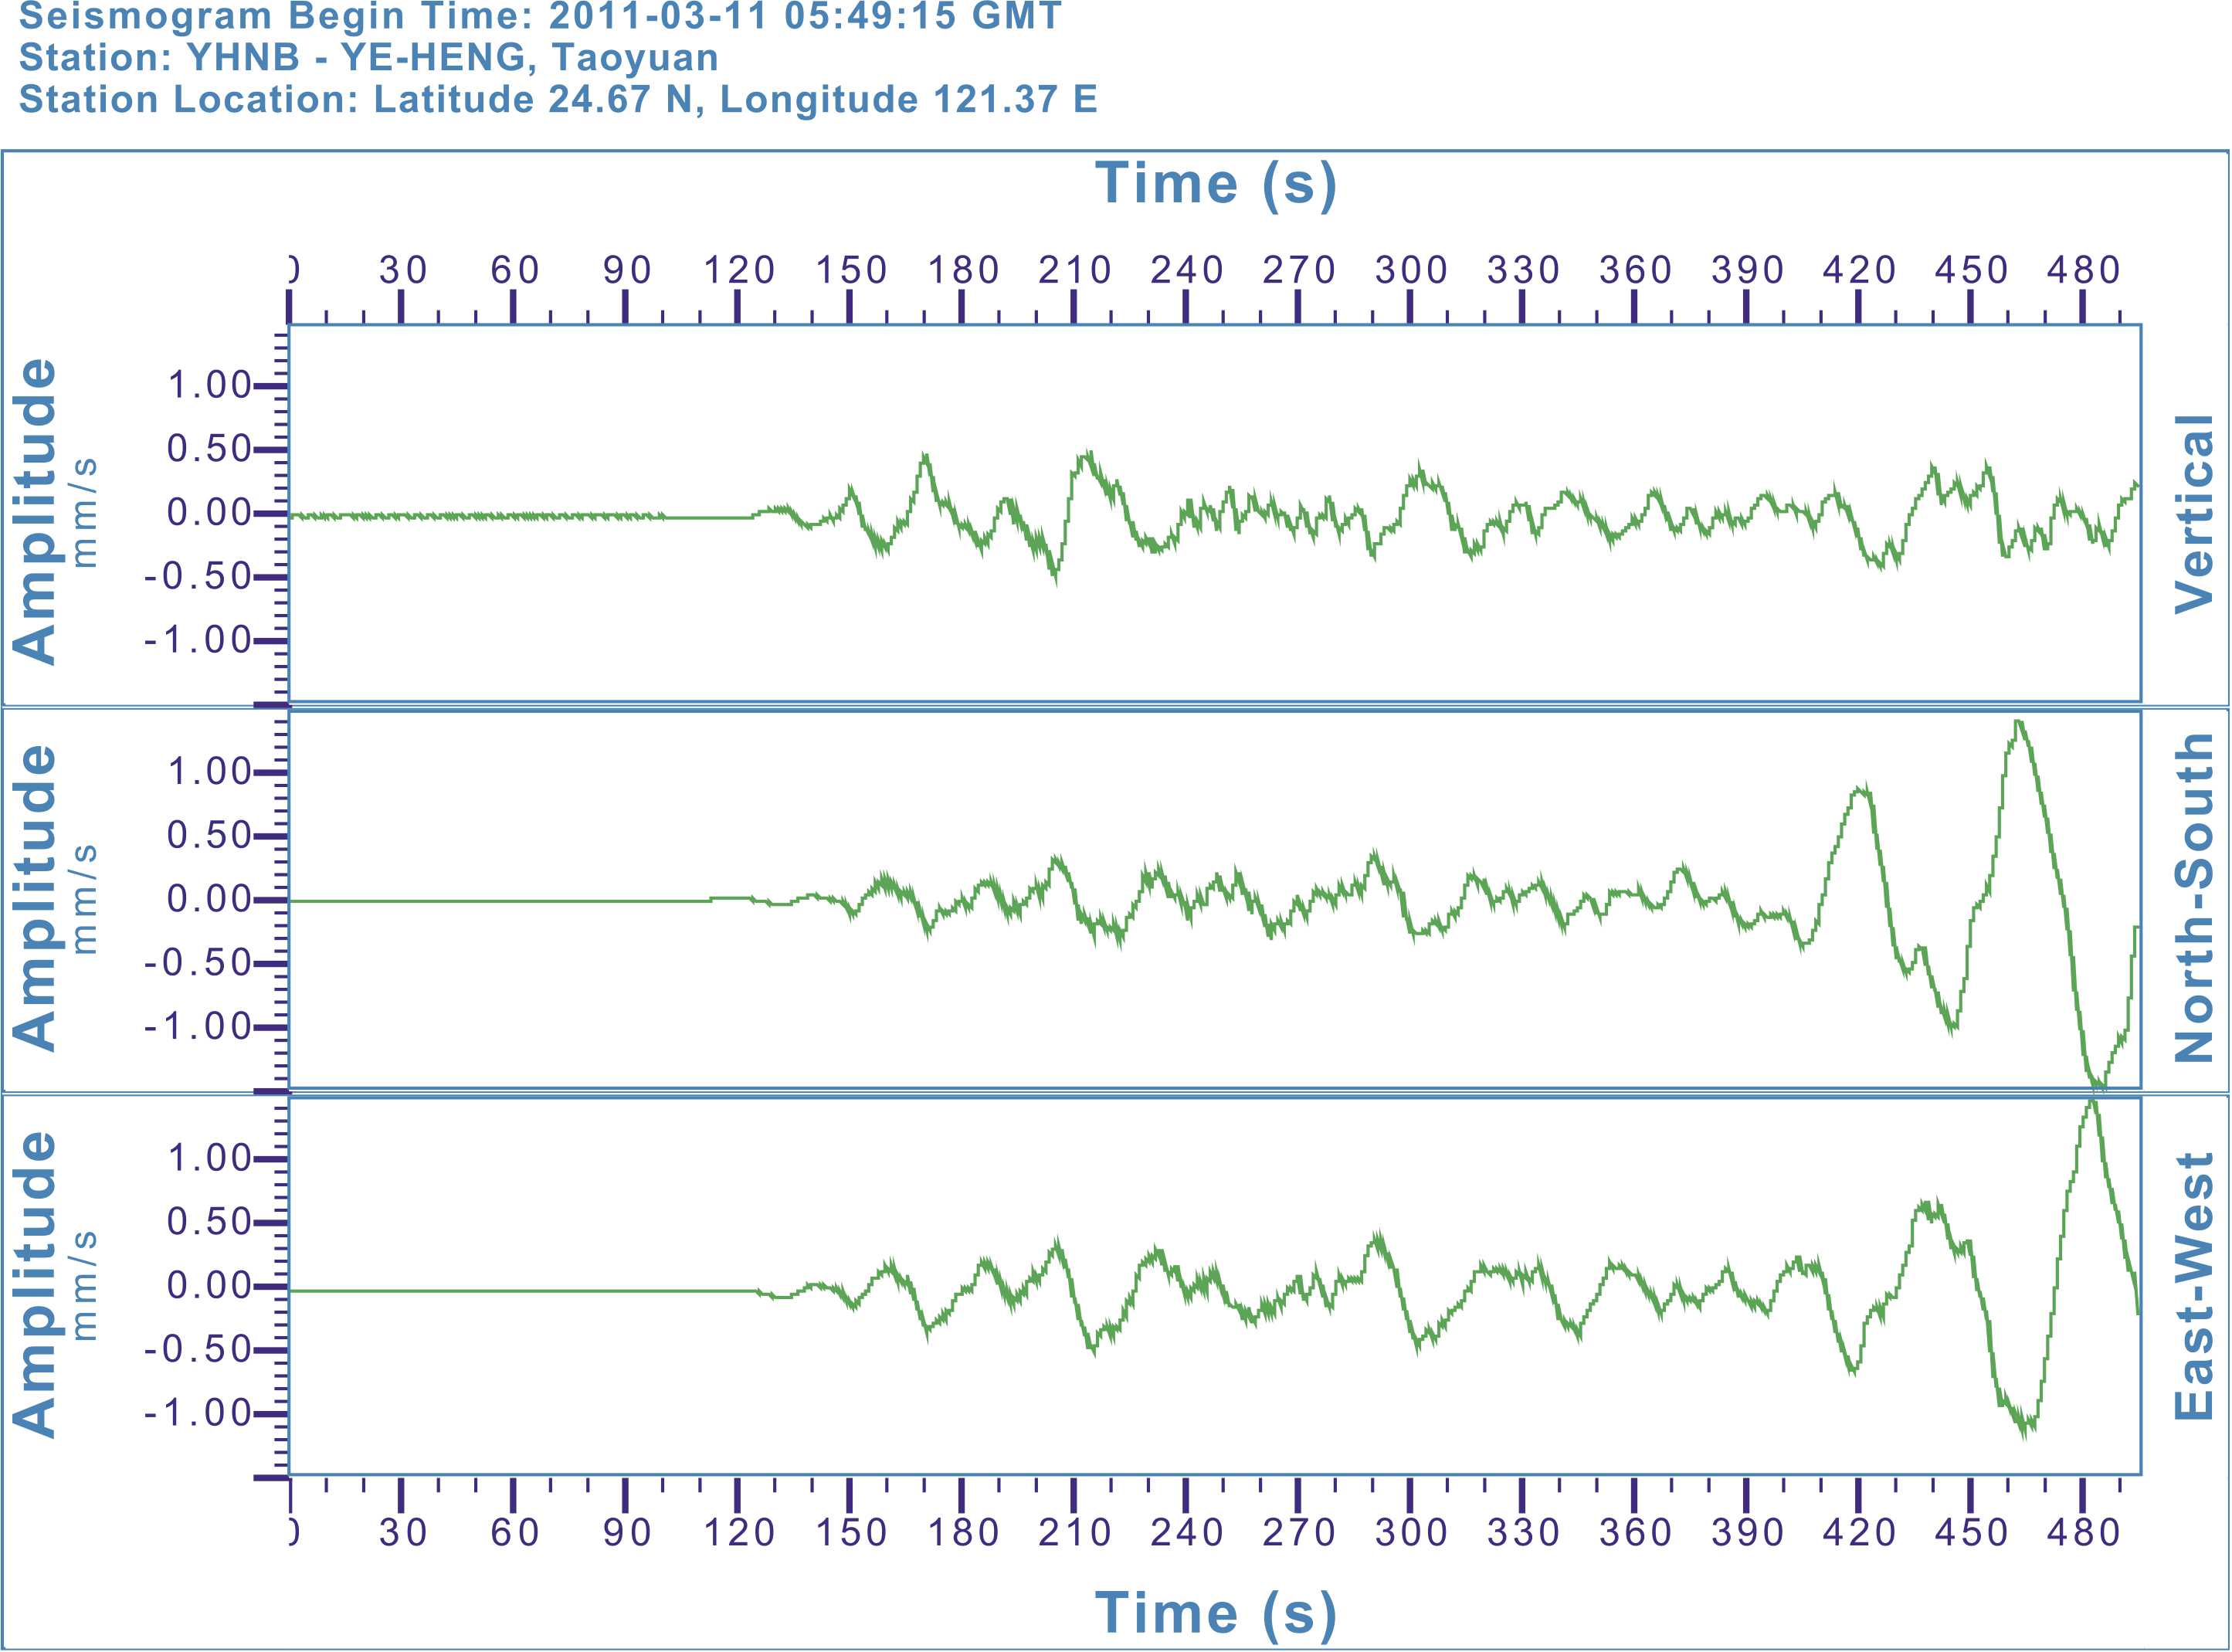 Seismograms from Taoyuan, Taiwan. Print seismic data.
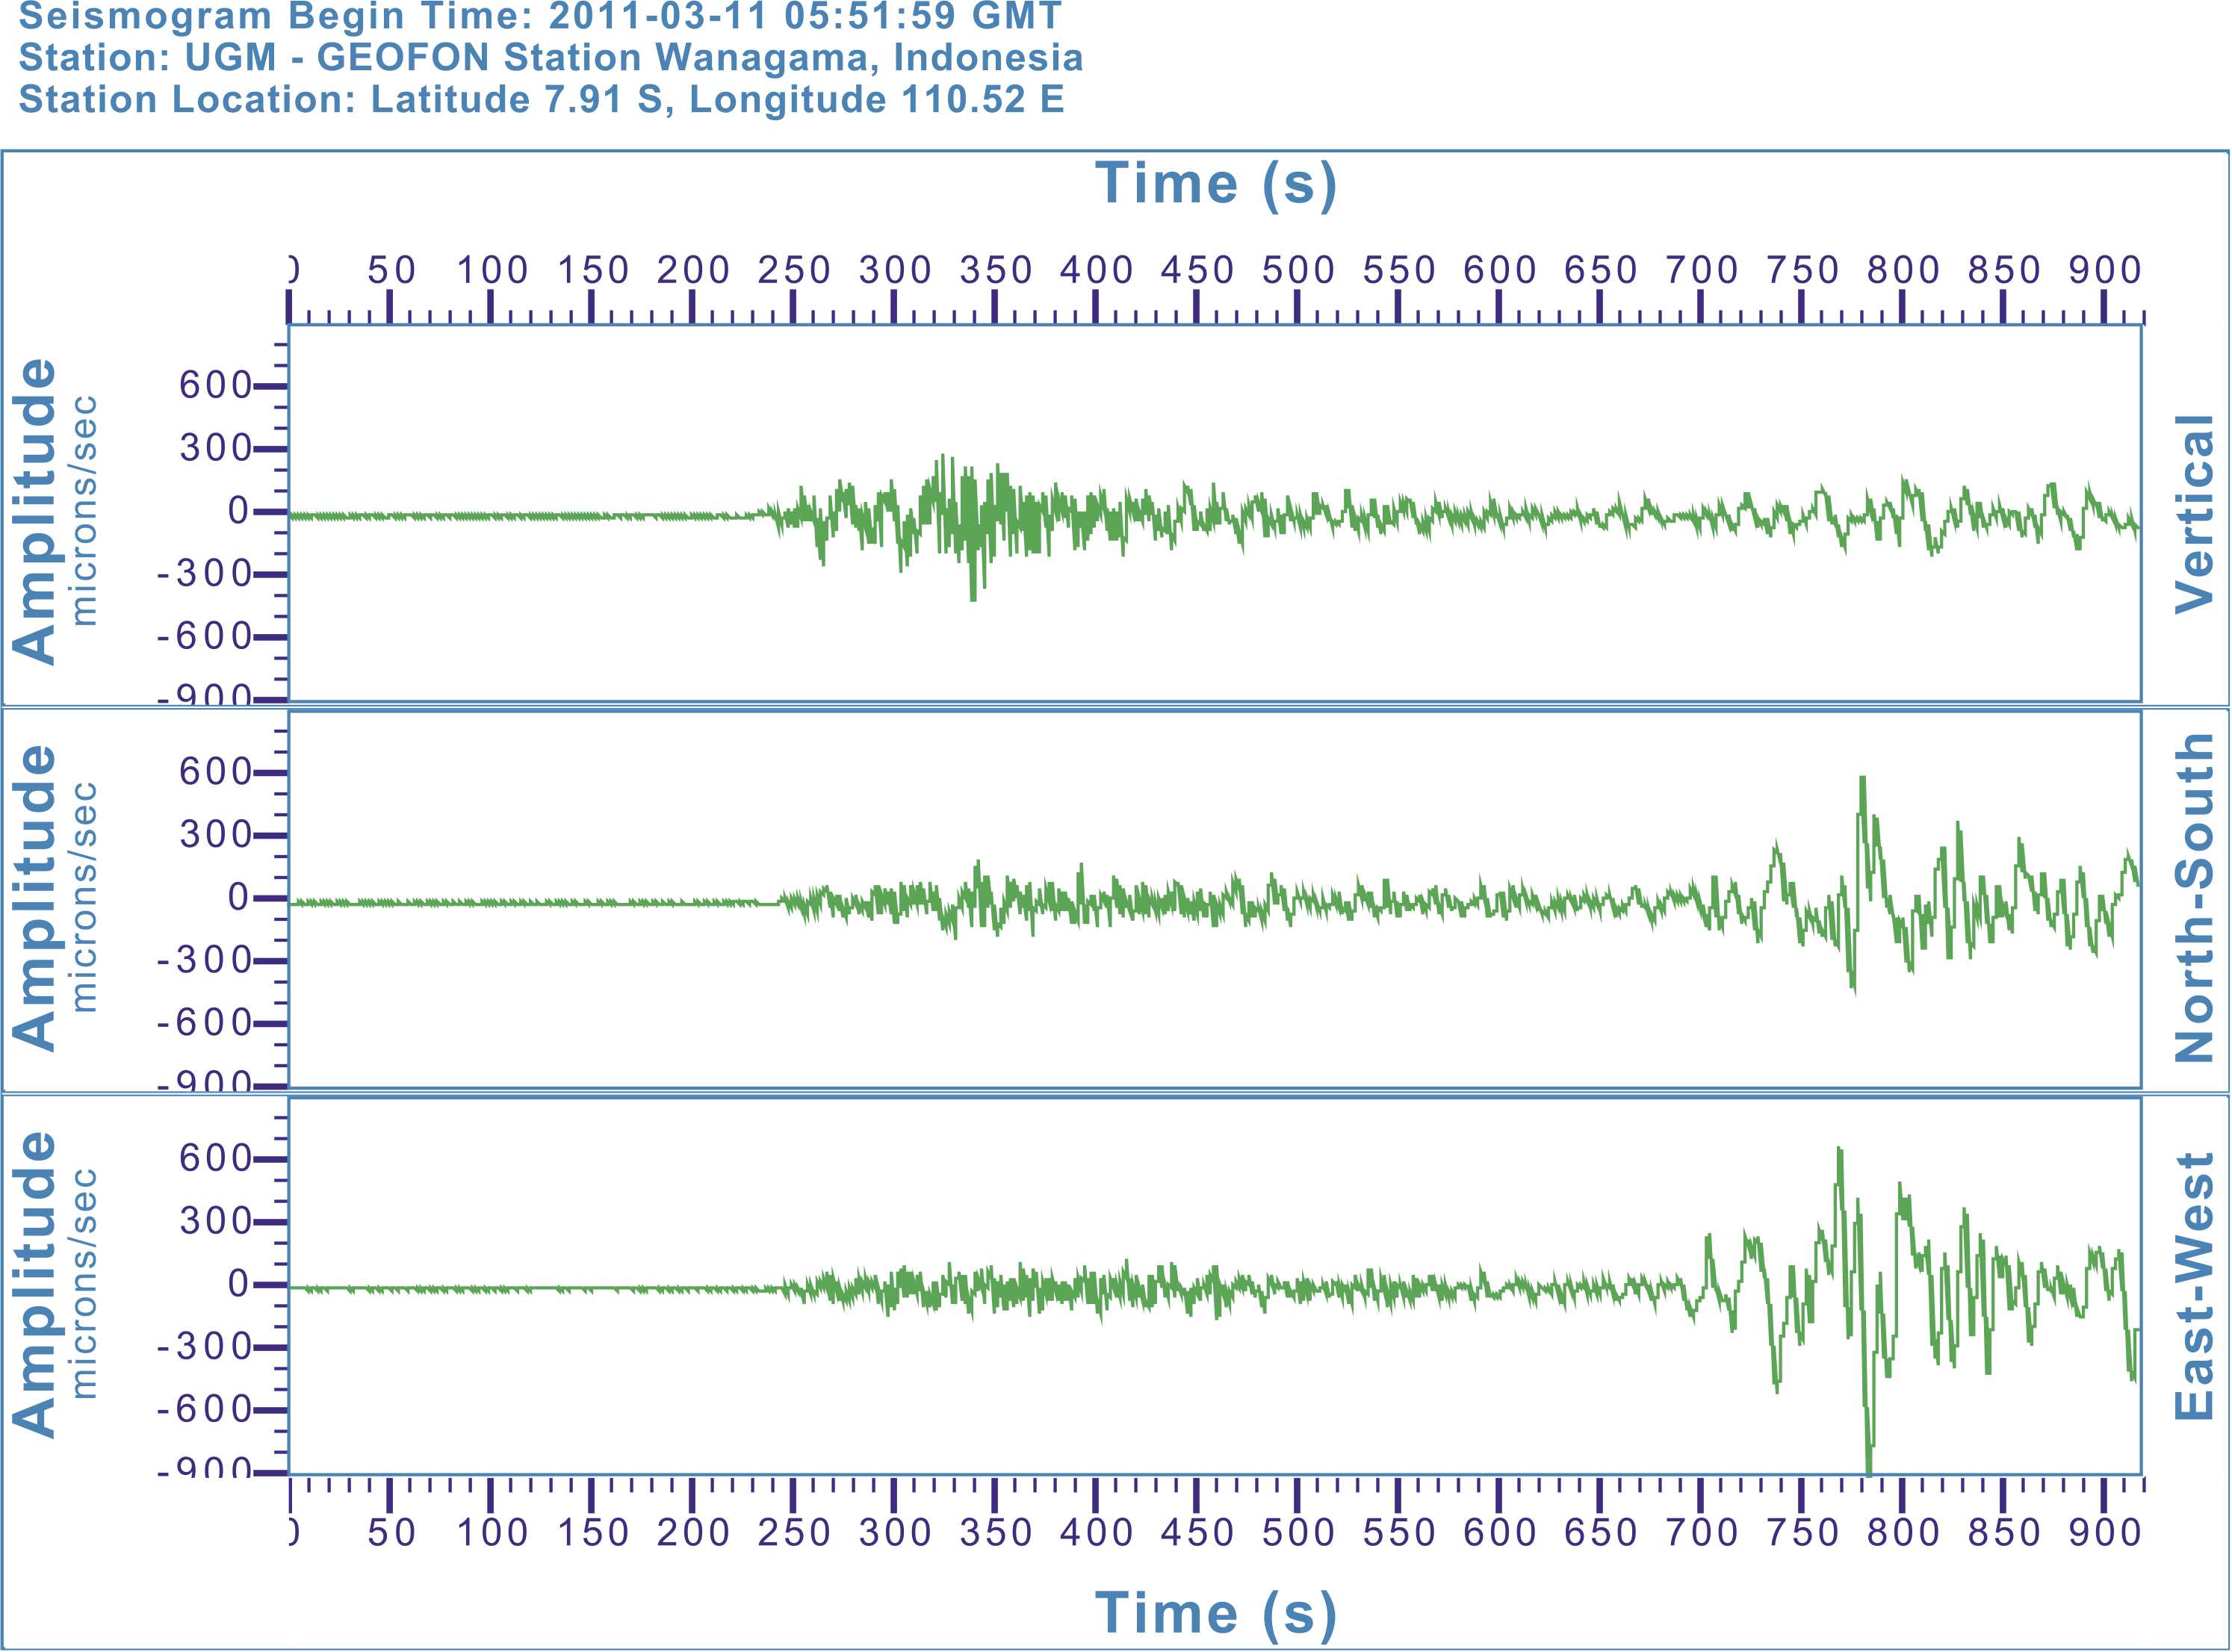 Seismograms from Wanagam, Indonesia. Print seismic data.
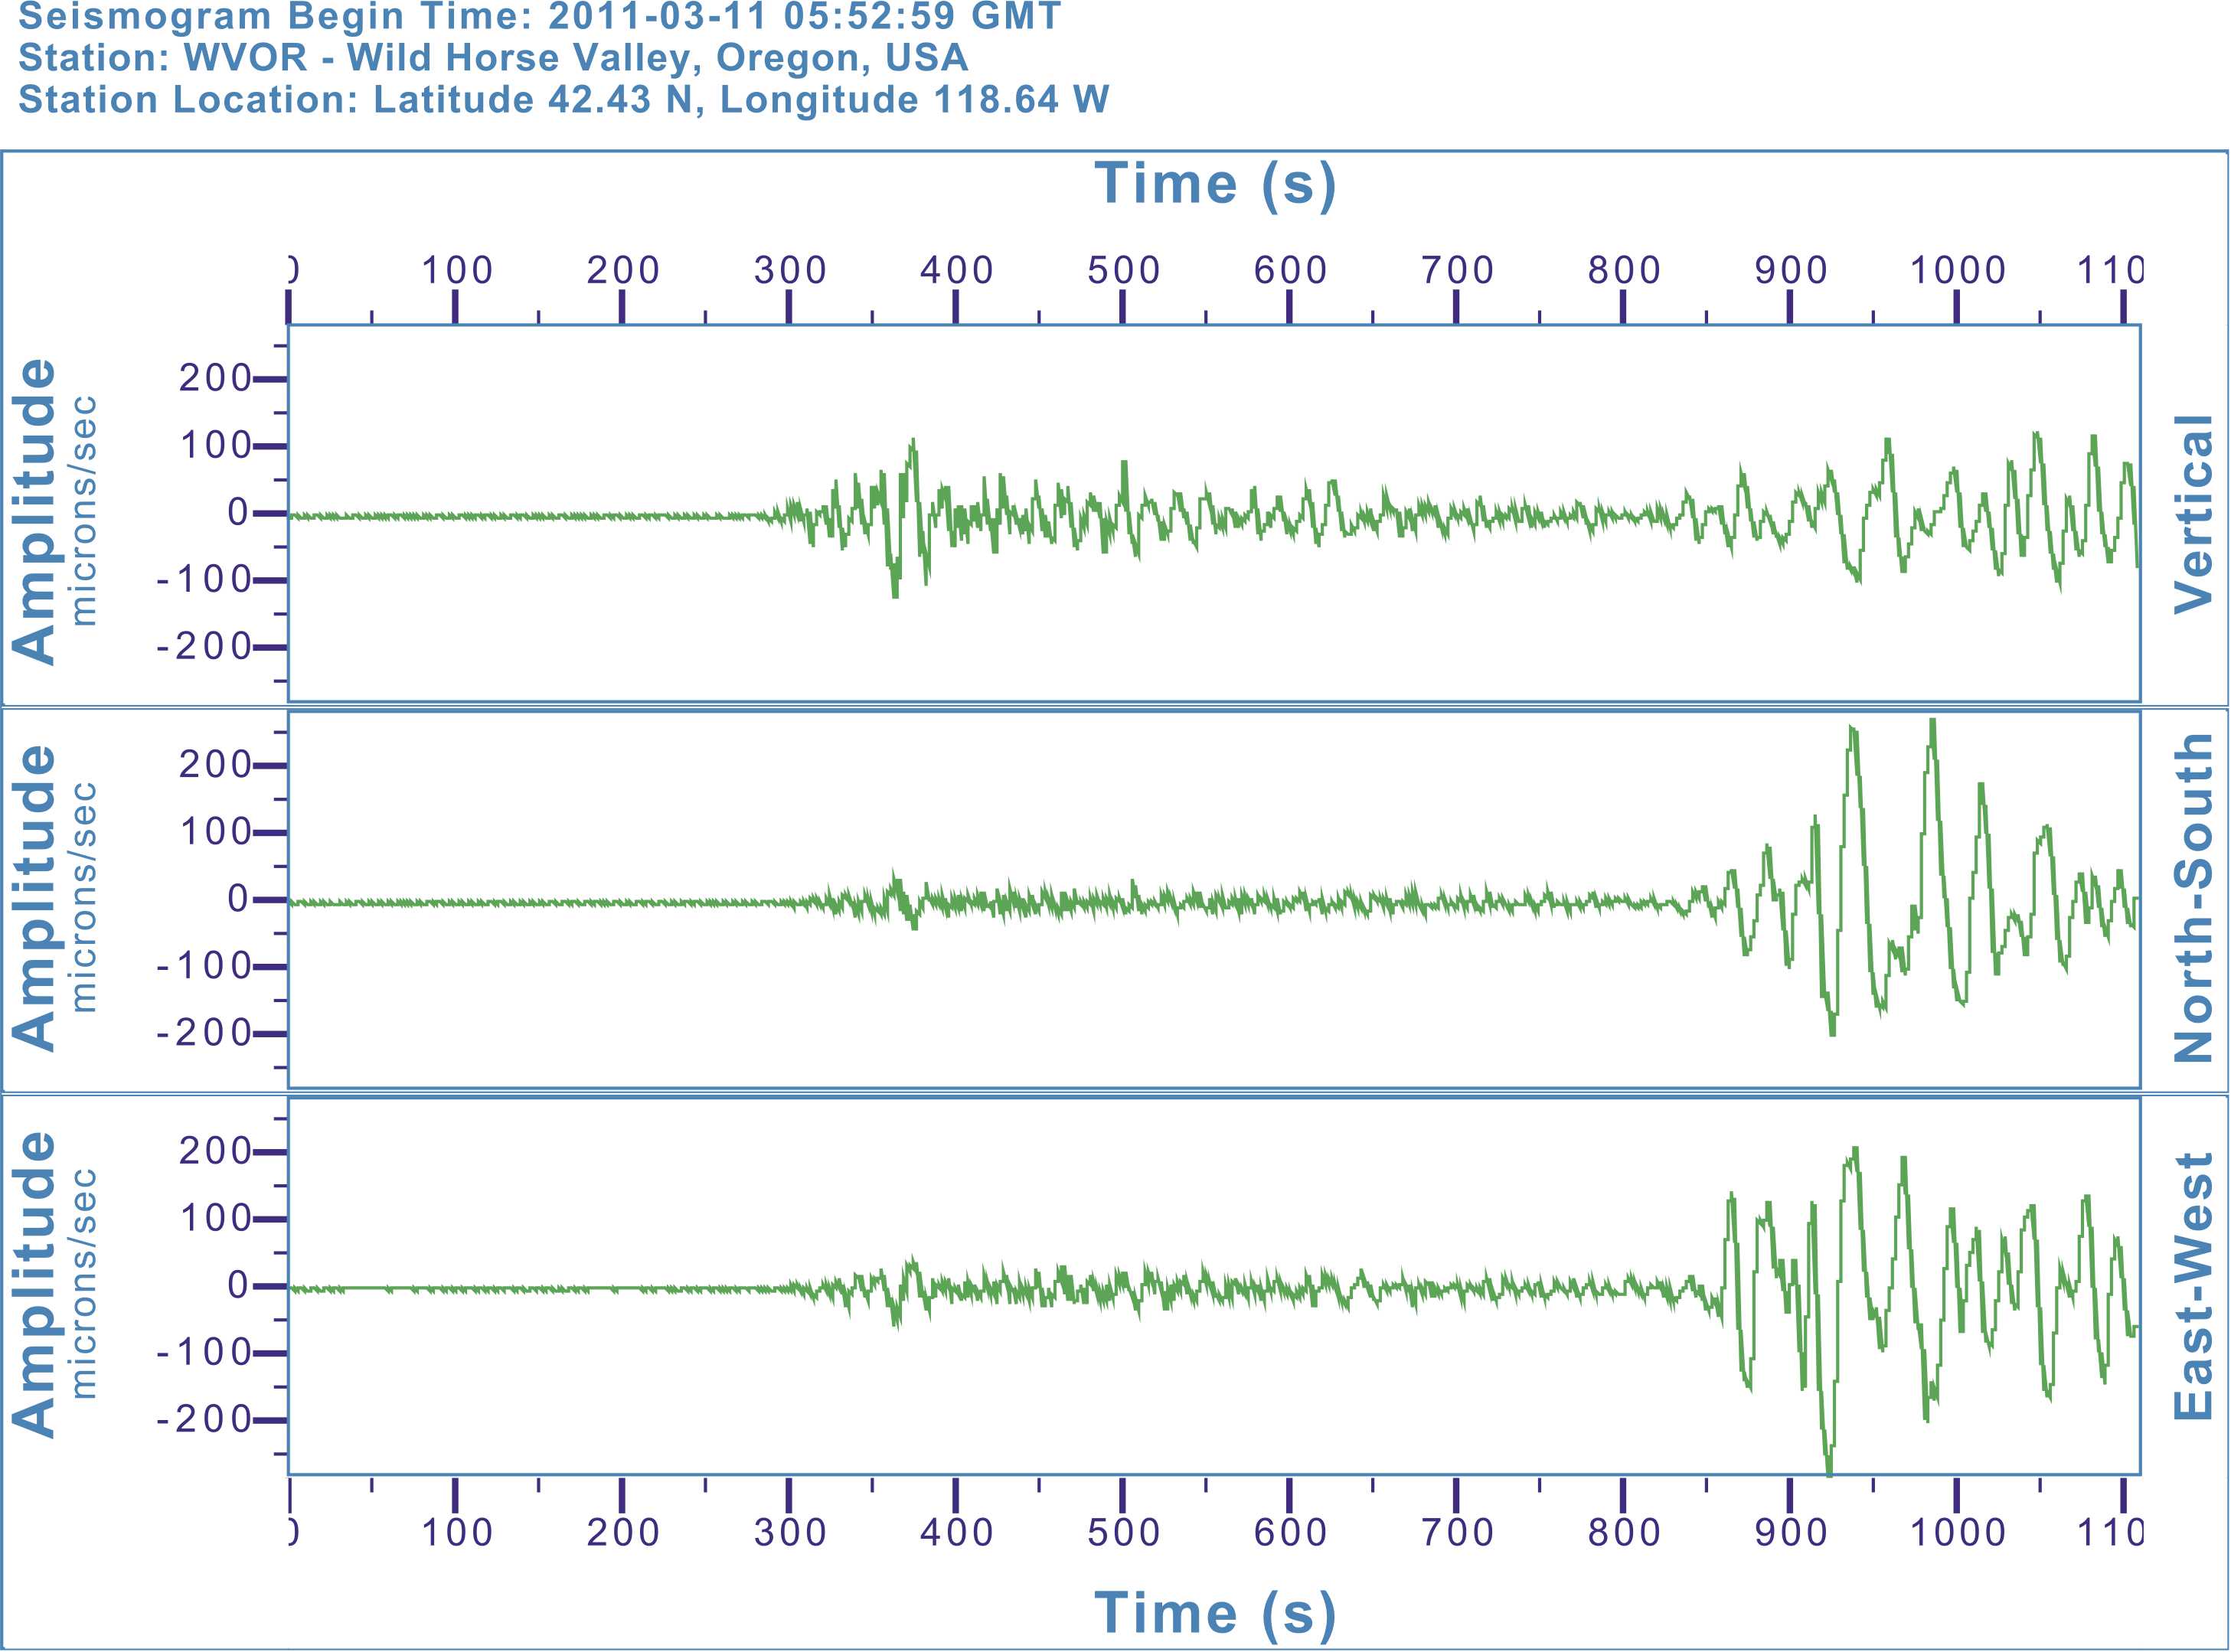 Seismograms from Wild Horse Valley, Oregon, USA. Print seismic data.
Procedure
1. Examine the provided seismograms sent from the three reporting stations. Measure the P and S wave time delay for each seismic station by locating the arrival time of the P and S waves on the seismograms. For each seismic station, subtract the P wave arrival time from the S wave arrival time to determine the S – P difference.
2. Use the provided S-P wave travel time graph to determine the distance from each reporting seismic station to the epicenter of the earthquake.
Hint: Use the S – P value for each station to find the locations on the graph where the S and P wave curves have separations equal to your calculated S – P arrival times. Refer to Lesson E3-4: Calculating the Location of an Earthquake to remind yourself how this is done.
3. On the globe in the main view, use the circle measuring tool located on the toolbar to plot a circle around each seismograph station whose radius is equal to the distance determined in step 2.
The earthquake epicenter is located where all three circles intersect. The three circles might not all sharply intersect in one point because of measurement error. If you have measured with reasonable accuracy your three circles should overlap with a very small common area. This small common area is where the earthquake epicenter is located.
If you need help analyzing the station data, click the View Answers button below.
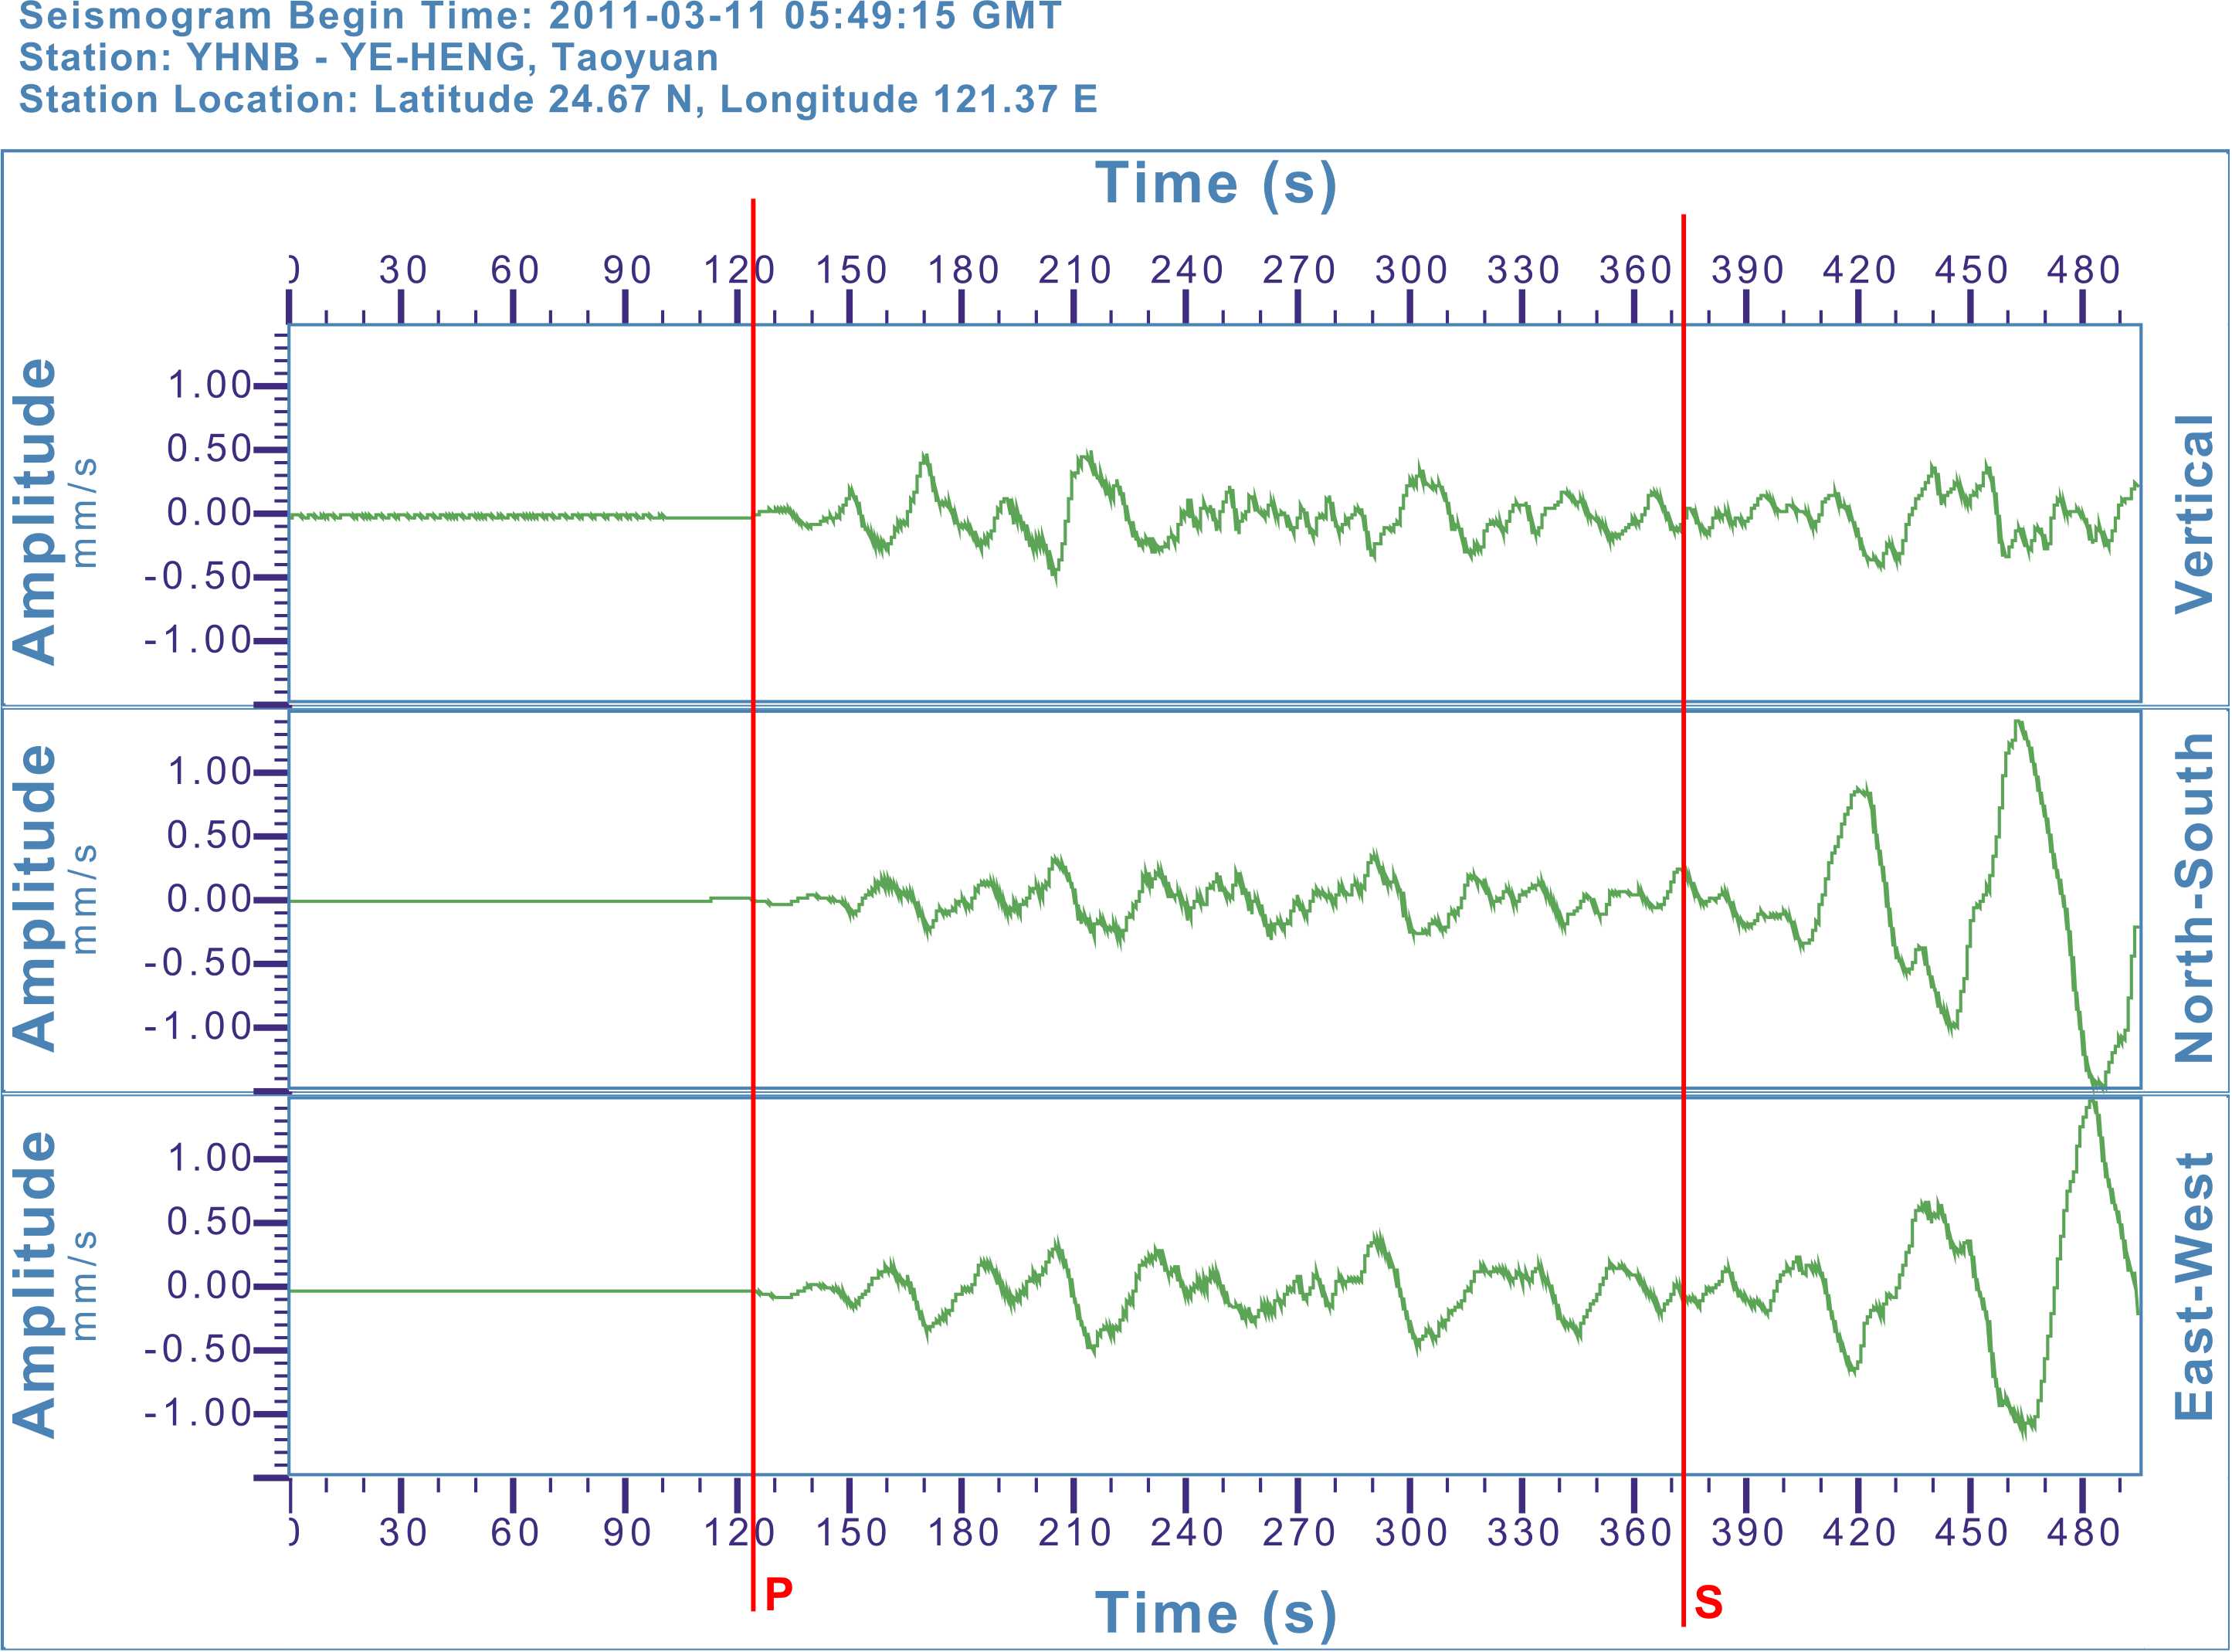 Seismograms from Taoyuan, Taiwan. P and S wave arrival times have been inserted on top of the data.
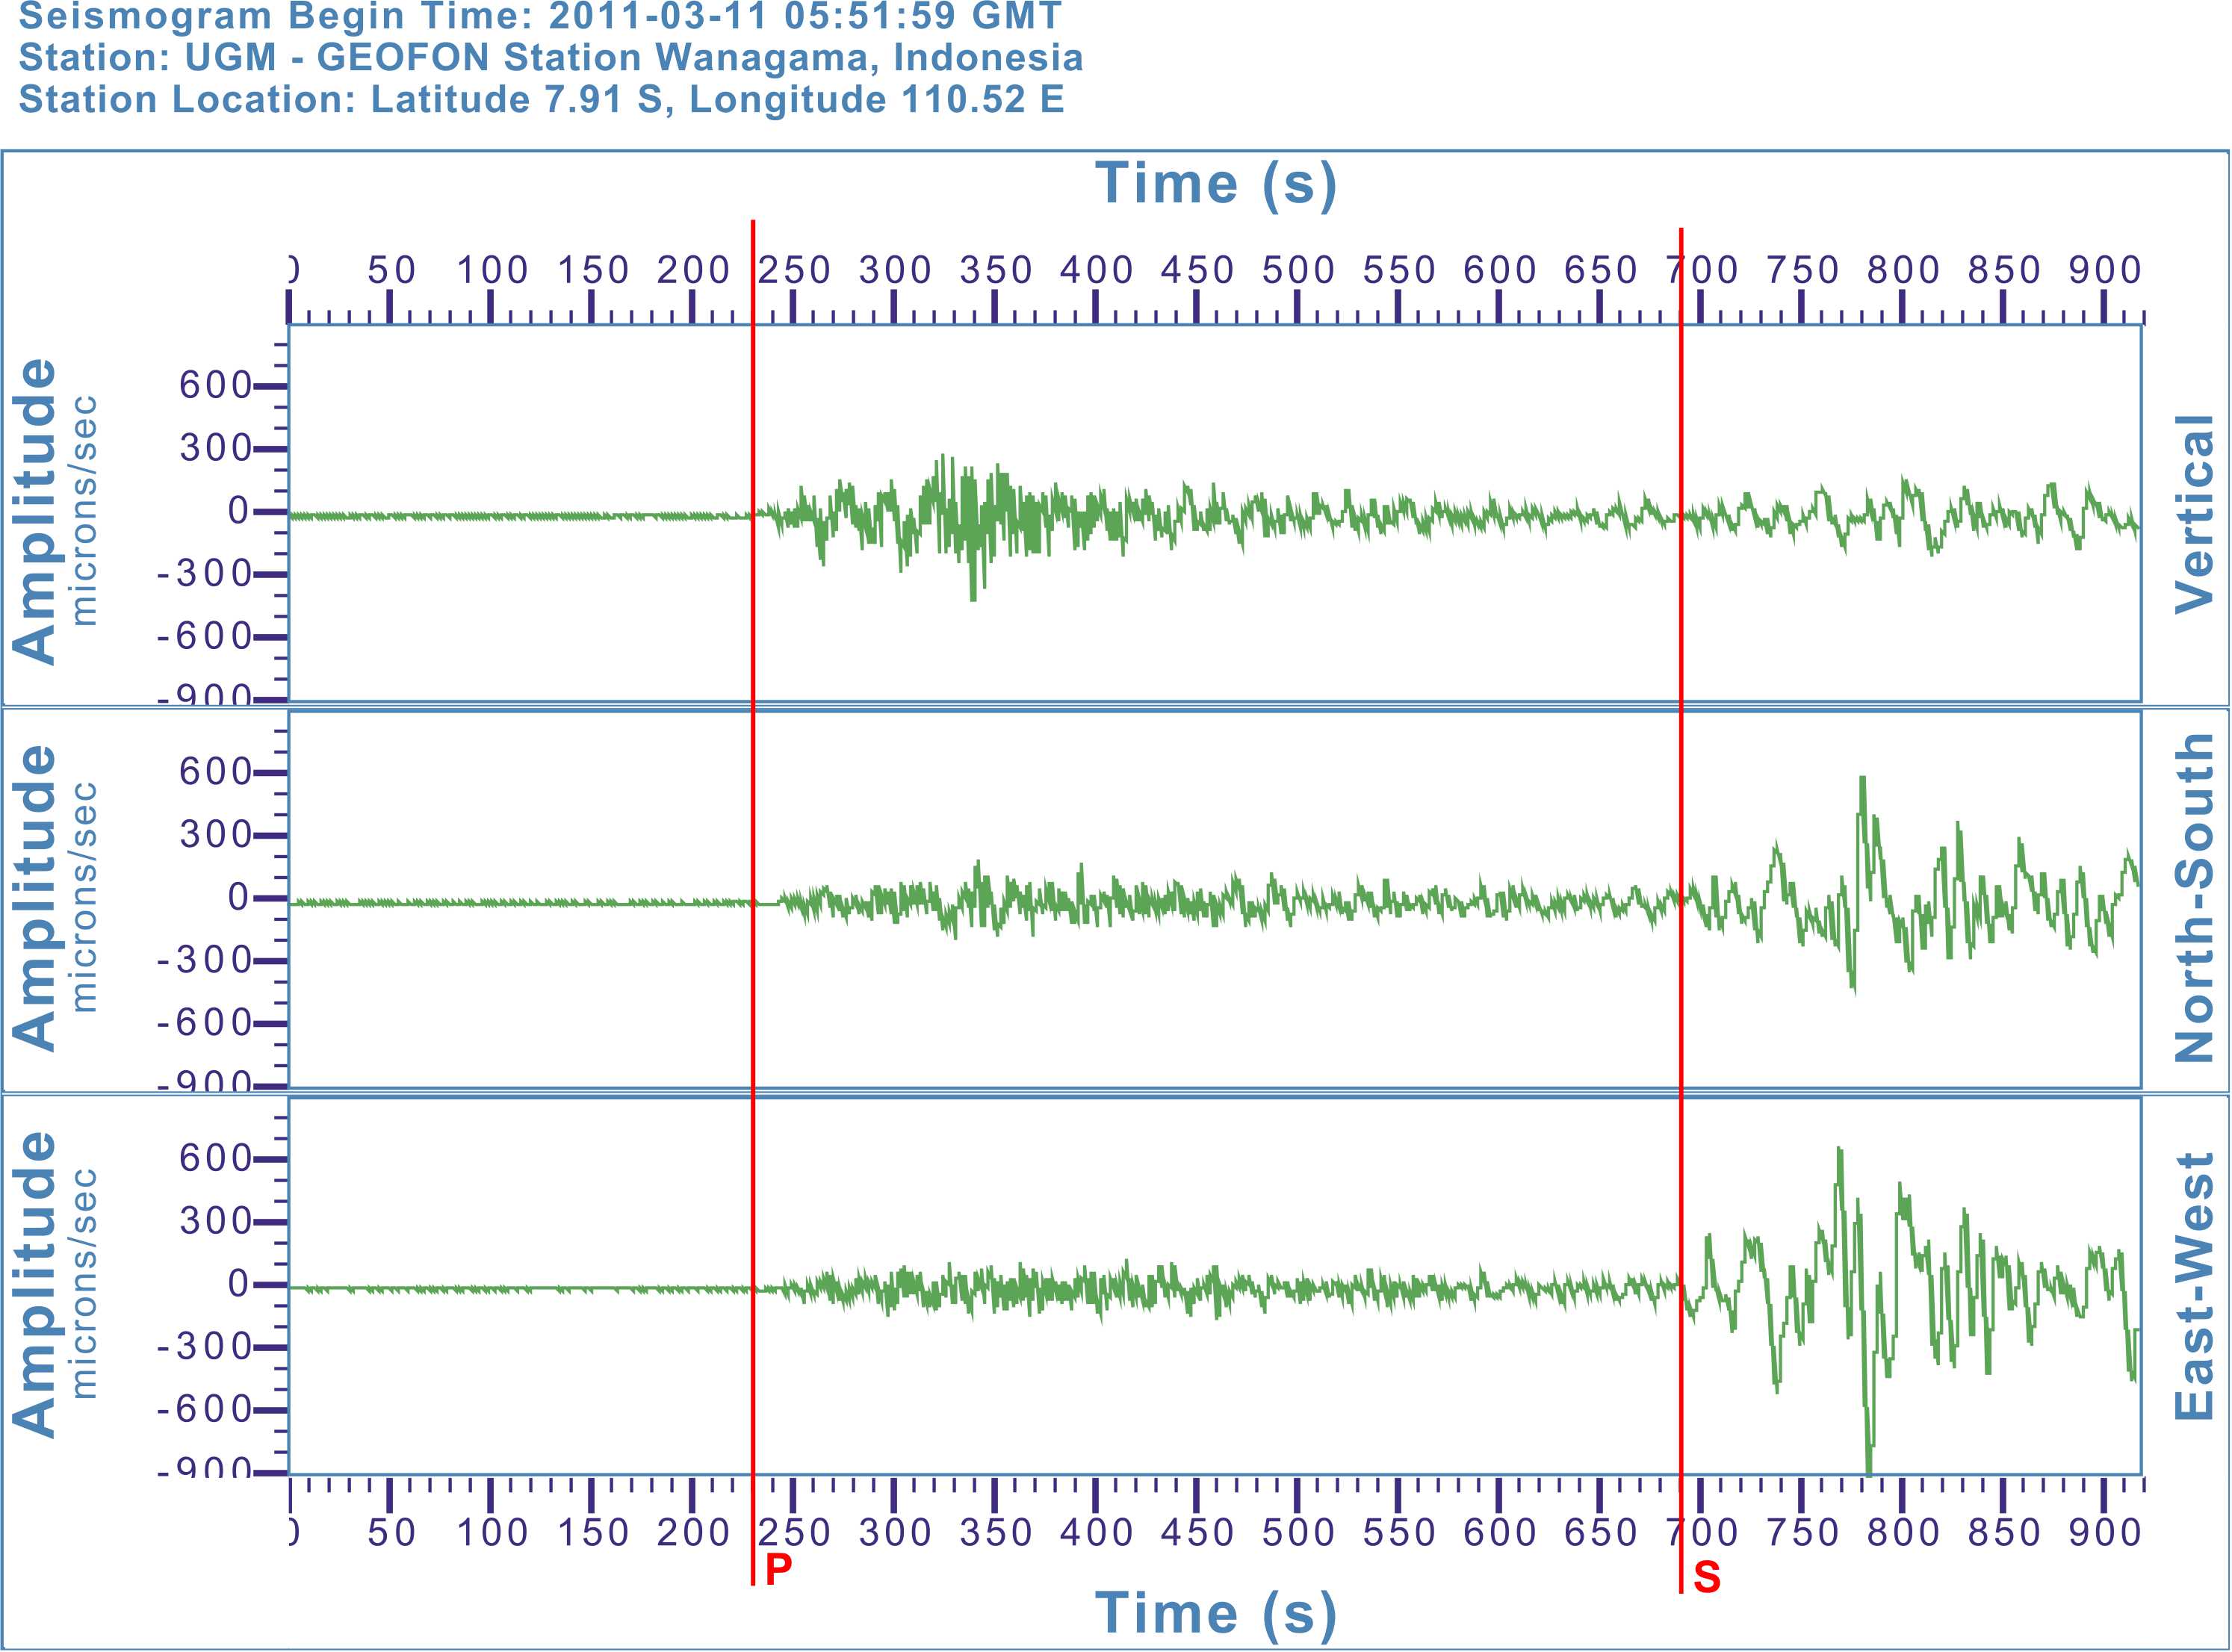 Seismograms from Wanagam, Indonesia. P and S wave arrival times have been inserted on top of the data.
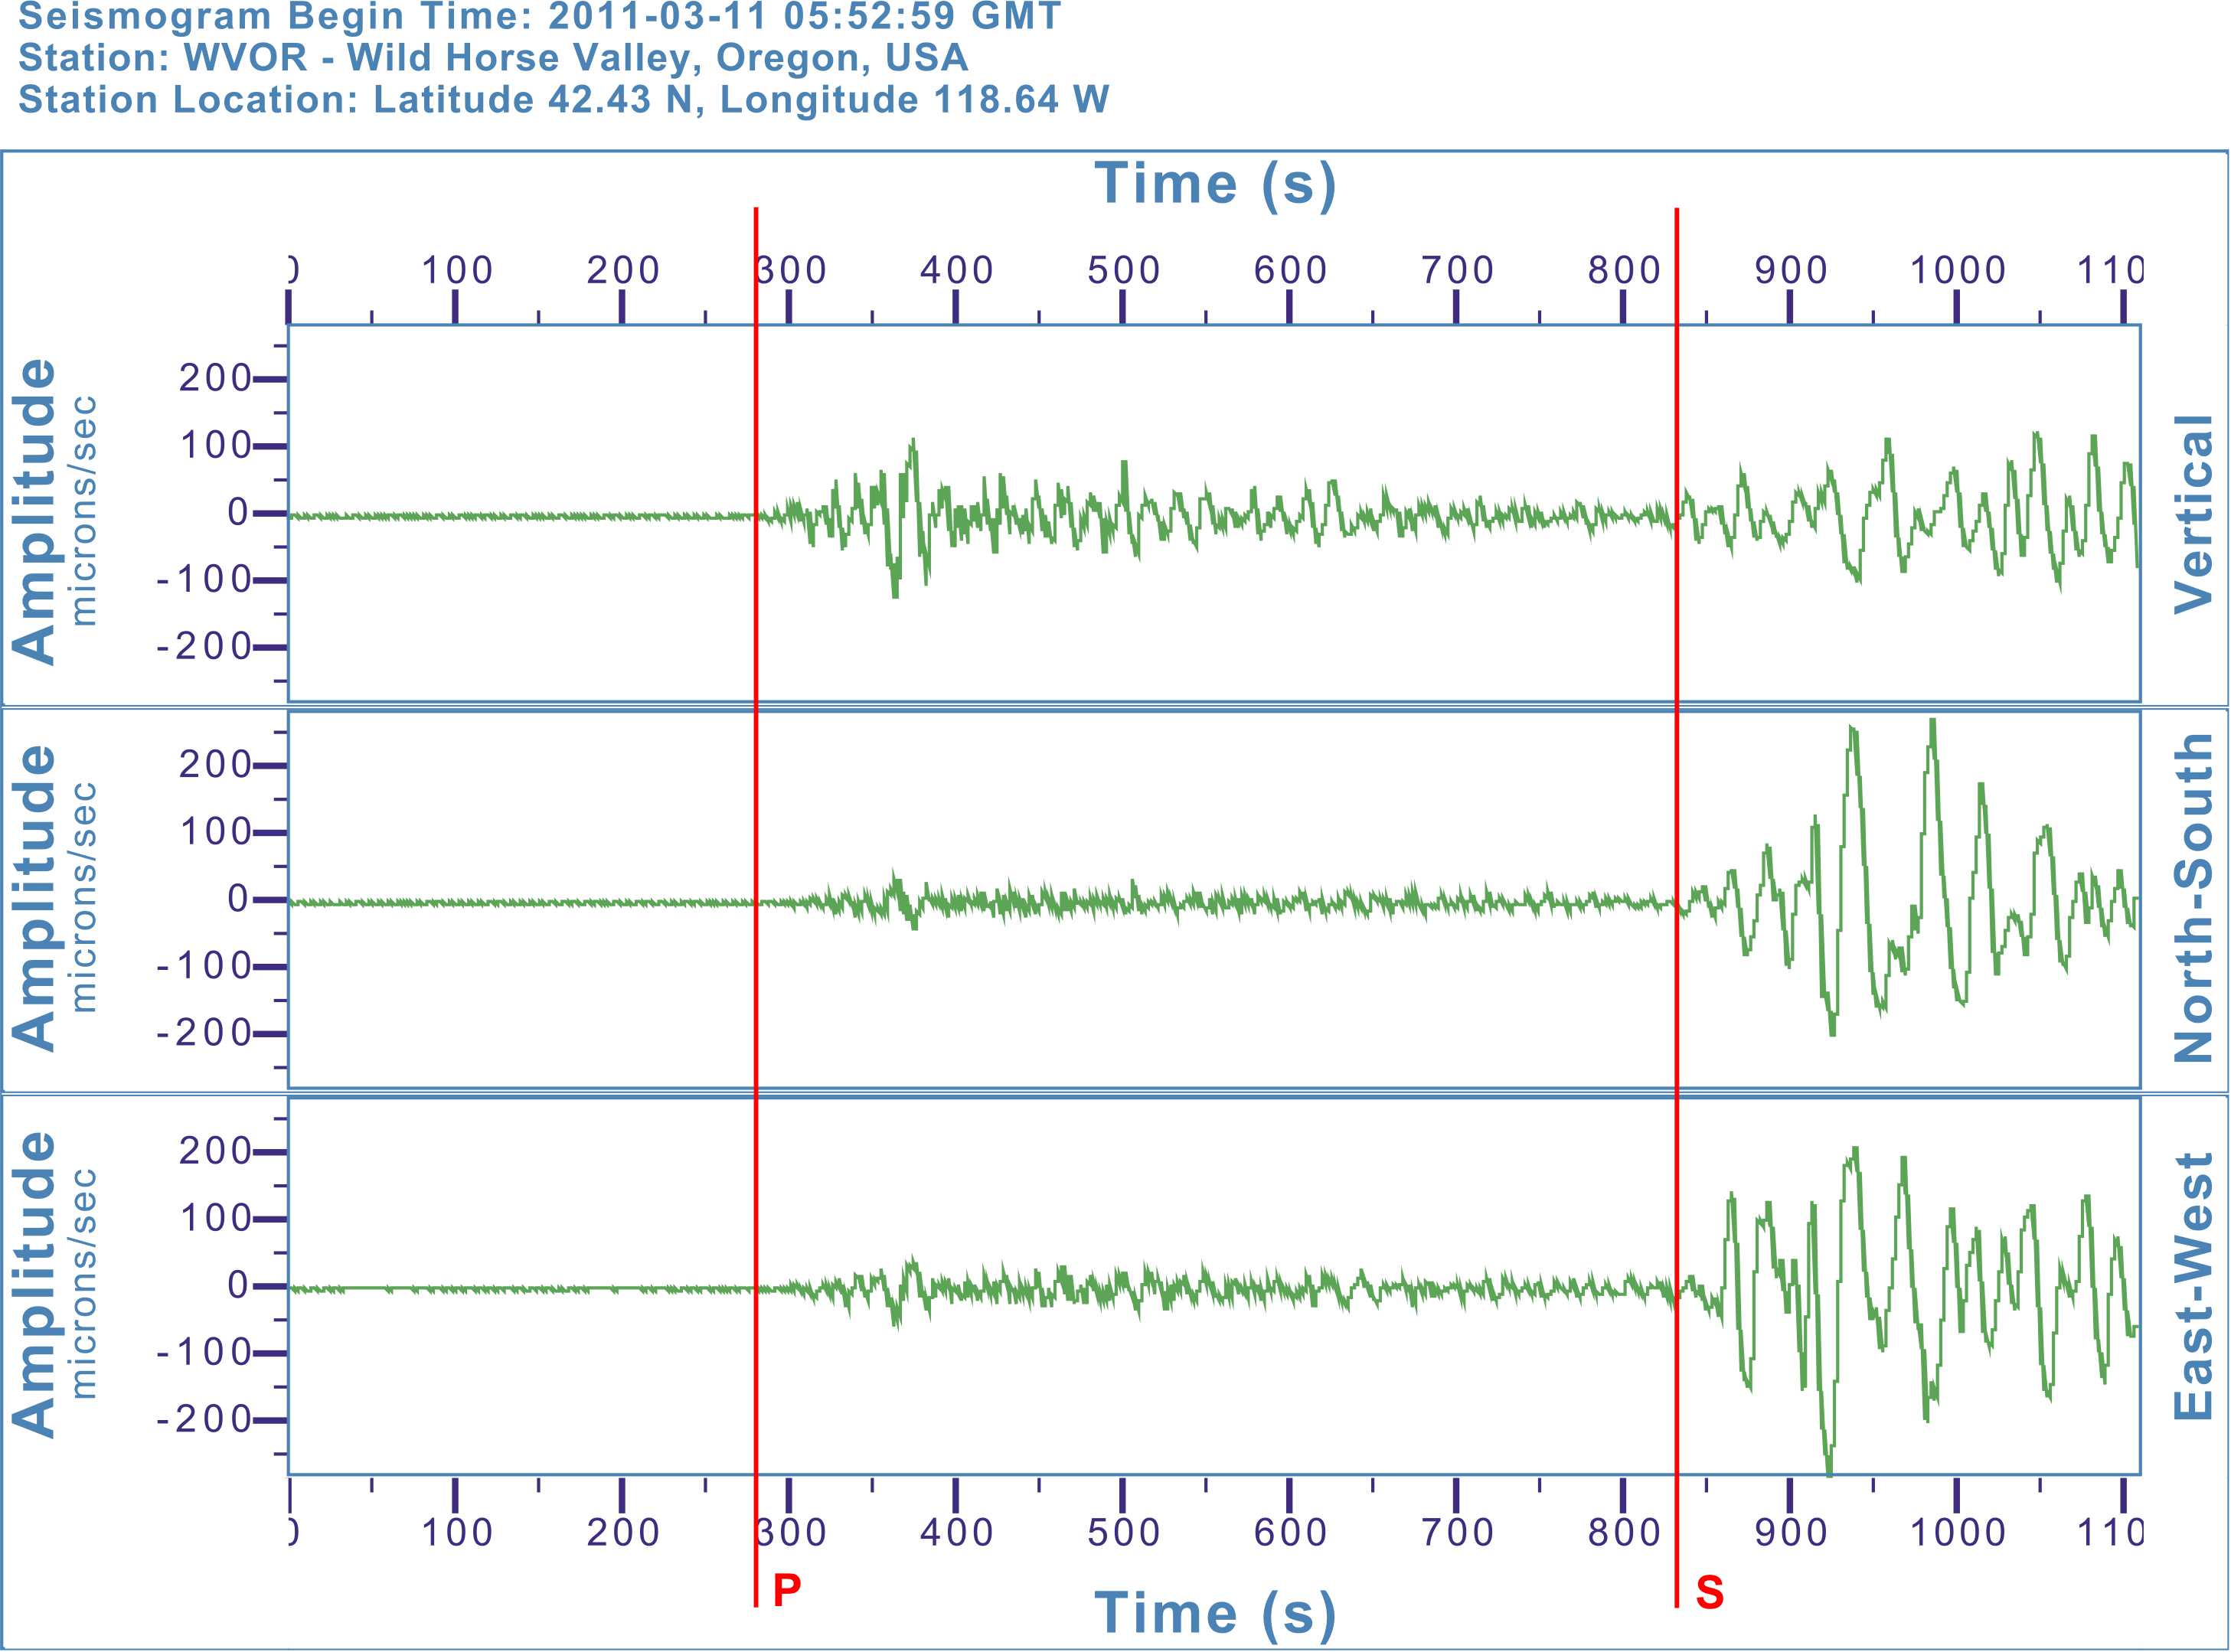 Seismograms from Wild Horse Valley, Oregon, USA. P and S wave arrival times have been inserted on top of the data.
- What location (latitude and longitude) did you determine for the earthquake location?
| Receiving Station | Travel-time delay for P and S curves (minutes) | Corresponding distance (km) from travel-time graph |
| Ye-heng, Taoyuan, Taiwan | 4.1 (actual value is 4.13) | 2,500 (actual value is 2,493) |
| Geofon, Wanagama, Indonesia | 7.8 (actual value is 8.0) | 6,100 (actual value is 6,085) |
| Wild Horse Valley, Oregon, USA | 9.3 (actual value is 9.27) | 7,900 (actual value is 7,904) |
- Click here to show the actual location of the earthquake.
- Use the line distance tool located in the toolbar to measure the distance between your calculated location, and the actual location of the earthquake. This will give you the error in your calculated location.
- What was your error in the calculated location for the earthquake? Answers will vary depending on how accurately your calculations were done. The seismogram data is sufficiently accurate (particularly if you made use of the hints in determining the arrival times of the P and S waves) that your error should be less than 50 km.
- What are some possible sources of error for your calculation of the earthquake location? Sources of error could include improper determination of the arrival times of the P and S waves, errors in using the travel-time graph for the P and S waves, faulty circle diagrams drawn around each receiving station, and simple math calculation errors.