To successfully complete the Unit Activity, you will need to know how to use seismic data to locate the epicenter of an earthquake. The following activity will help you to understand how seismologists calculate the location of an earthquake and will also help you with the Unit Activity.
You will need to use graphing paper in order to complete Part II of this Learning Activity.
Learning Activity
Part I: Using a travel-time graph to determine distance to the epicenter
Use the travel-time graph to answer the following questions.
 Travel-time graph for Part I.
- Complete the following table:
- Determine the arrival times for P and S waves for earthquake epicenters located at a distance of:
- 3,000 km
P wave: 5 min. 40 s., S wave: 10 min 10 s. - 9,500 km
P wave: 12 min. 30 s., S wave: 22 min. 50 s. - What would the time delay between P and S waves be for an earthquake whose epicenter distance was:
- 8,000 km
approximately 9 minutes and 20 seconds - 2,000 km
approximately 3 minutes and 5 seconds
| P wave arrival time | S wave arrival time | Distance from epicenter |
| 9 min. 25 s. | 17 min. | 6,000 km |
| 7 min. 50 s. | 14 min. | 4,600 km |
Part II: Locating the epicenter of an earthquake using triangulation
Data from one seismograph station will allow us to draw a circle whose radius equals the distance from the station to the earthquake. The epicenter for the earthquake could be anywhere on this circle. Data from a second seismograph station allows us to draw a second circle. This second circle intersects the first circle at two points, narrowing our epicenter down to two possible locations. Data from a third seismograph station is necessary to accurately determine the epicenter. The epicenter will be located where the three circles intersect. This process of using three separate data sets in geology to locate one unique common point is called triangulation.
 Using triangulation to locate the epicenter of an earthquake.
You will need to use graphing paper in order to complete this exercise.
- Label a sheet of graphing paper so that the coordinates along both the x- and y-axes go from at least –10 to 10.
- Seismic Station A is located at grid coordinate (0,3). Plot this point on your grid and clearly label it. Station A receives a signal (i.e. the time difference between the arrival of the P and S waves) that indicates that an earthquake occurred at a distance of 6 units away from the receiving station. Now carefully draw a circle with a radius of 6 units around Station A.
- Station B is located at (–5,–5). Plot the location of Station B. Station B’s signal indicates that the earthquake occurred 5 units away. Draw in a circle with a radius of 5 units around Station B.
- What are the two possible grid locations (x- and y-coordinates) for the earthquake?
The earthquake is located at one of two points where the circles around stations A and B intersect, either (–5.2,0) or (–0.5,–2.9). - Station C is located at (3.2,–5) and its signal indicates that the earthquake is 4.2 units away. Again, plot the station location and a circle around the station showing the possible location of the earthquake.
- Examine your graph carefully, and determine the exact grid location for the location of the earthquake’s epicenter.
All three circles intersect uniquely at (–0.5,–2.9). This is the location of the earthquake’s epicenter.
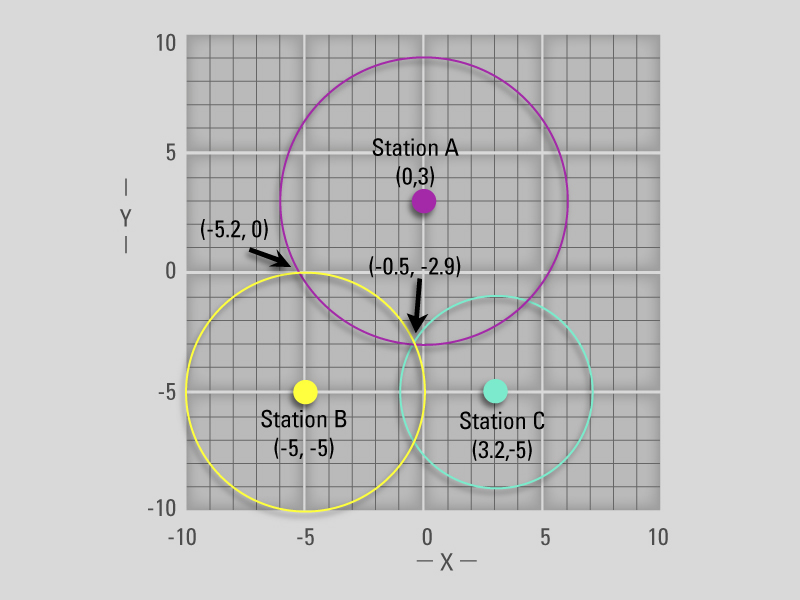 Your triangulation worksheet should look similar to this graphic.