4
The Tsunami
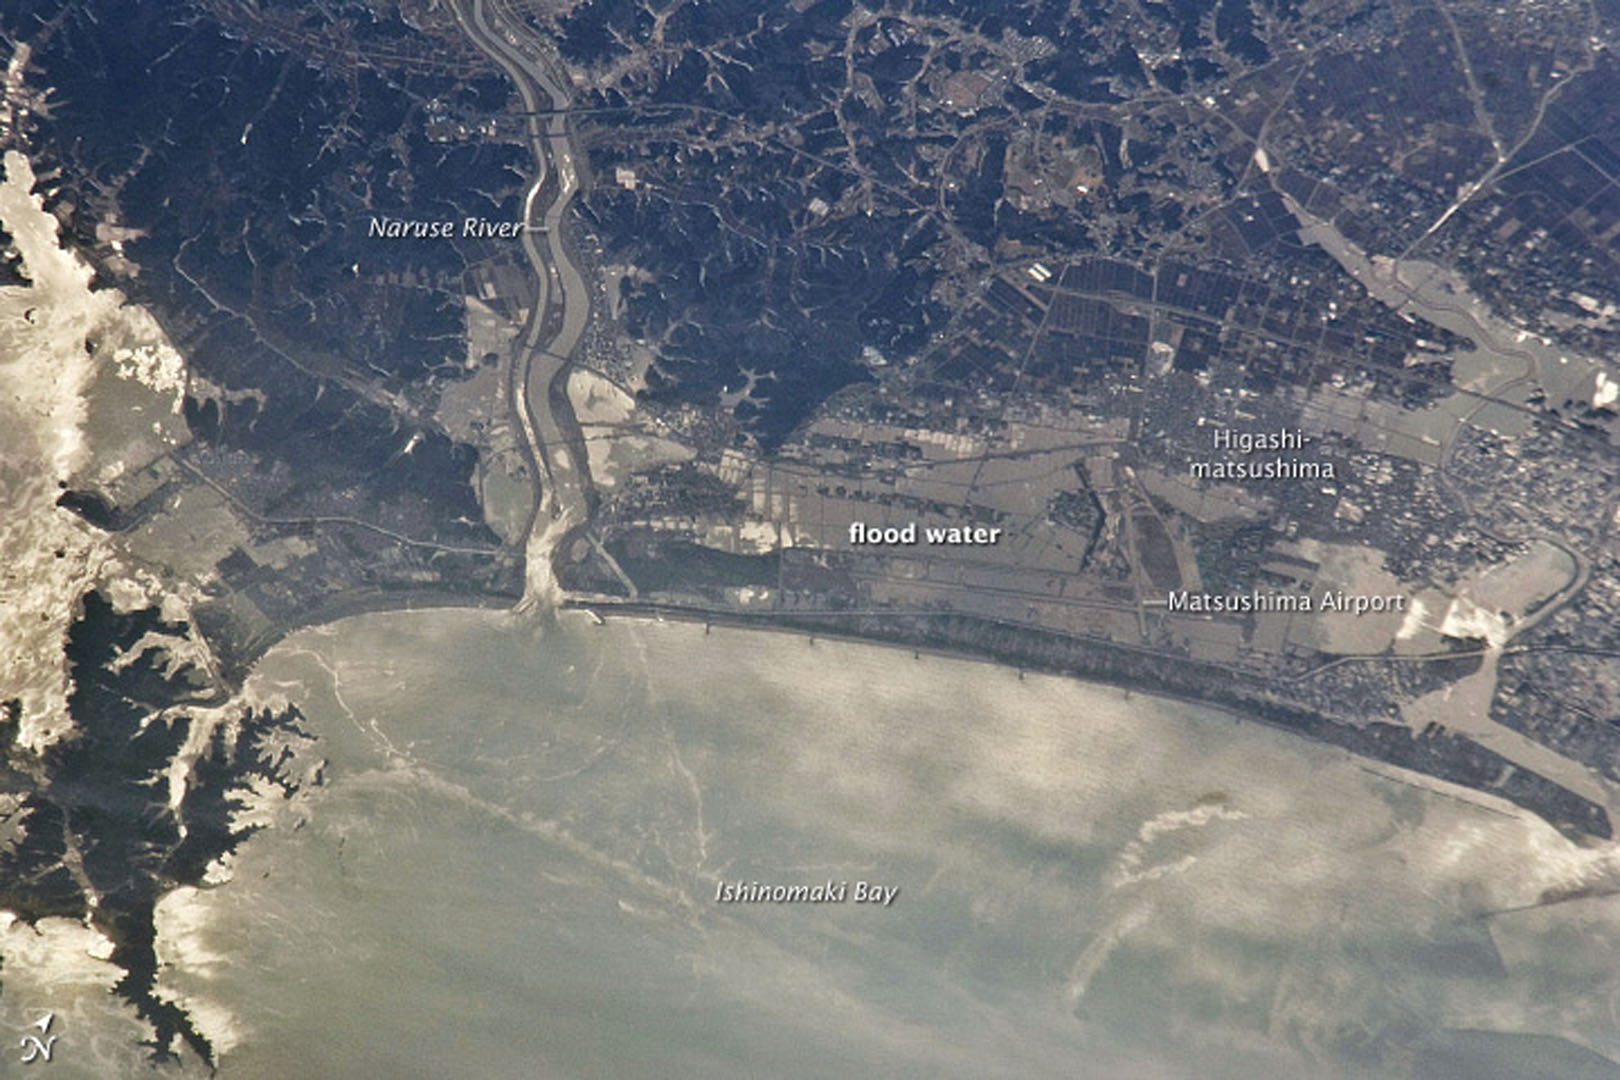 This photograph from the international space station was taken on March 13, 2011. It shows the extensive flood damage still evident even two days after the tsunami struck on March 11.
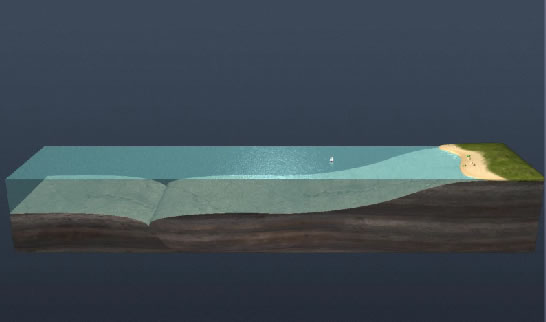 Animation illustrating how water in a tsunami piles up into a large wave in coastal areas.
The earthquake in Japan occurred as a result of crust slippage between the Pacific plate and the Okhotsk plate. The sudden movement of the crust as pressure was released at the slippage point also resulted in a massive displacement of water. The energy released by this large underwater disturbance generated a giant water wave known as a tsunami. The tsunami that hit the coast of Japan was estimated to have a height in excess of 10 m (33 feet).
- Click here to see a tsunami height map for Japan.
- Which parts of Japan did not experience severe tsunami heights? Parts of the west coast did not experience severe tsunami heights.
- Why do you think these areas were protected from the worst effects of the tsunami? This was mainly because the earthquake occurred in the Pacific Ocean on the east side of Japan. The Japanese mainland acted as a barrier for the tsunami, and much of the energy in the tsunami wave was depleted by the time the tsunami reached parts of the western side of Japan.
- Click here to add in several communities on the tsunami height map for Japan.
- Fill in this table after examining the legend and the map carefully.
| Community | Tsunami Height |
| Ofunata | 3 meters or more |
| Sendai | 3 meters or more |
| Tokyo | 2 meters |
| Hiroshima | 0.5 meters |
| Nagasaki | 0.5 meters |
| Tottori | less than 0.5 meters |
| Sapporo | less than 0.5 meters |
- Click here to see an estimated tsunami wave height map for the entire Pacific Ocean basin.
- What is the scale interval for the wave height in the legend? The scale interval for the wave height in the legend is 20 cm (7.9 inches).
- Click here to add in the locations of some major cities in the Pacific basin.
- Rotate the globe and zoom in on each community in order to complete this table.
| Community | Estimated Tsunami Wave Height (cm) |
| Honolulu, Hawaii | 20 |
| Sydney, Australia | 5 |
| Auckland, New Zealand | 10 |
| Anchorage, Alaska | 3 |
| Victoria, British Columbia | 1 |
| Los Angeles, California | 5 |
| Acapulco, Mexico | 4 |
| Lima, Peru | 25 |
A tsunami travel time map has lines on it to indicate how long it took the tsunami travel through the Pacific basin.
- Click here to see the tsunami travel time map for the March 11 earthquake in Japan. Carefully examine the legend and the map.
- What is the travel time interval between each pair of lines (i.e. for each band of color)? The travel time interval between each pair of lines (i.e. within one band of color) is exactly one hour.
-
- Use the distance measuring tool and determine the average speed of the tsunami wave for each interval in any 5 hour segment of time (e.g. between the 5 hour and 10 hour lines). Once you do your first interval make sure that you continue measuring in the same direction. Since each time interval is 1 hour, measuring the distance will give a direct figure for the average speed (using v = d/t). The actual value will vary depending on what part of the Pacific basin is actually measured.
- What do you observe? Independent of where the distance is actually measured, you should notice that the average speed of the tsunami wave is slowly decreasing.
- How do you account for your result? Friction is the usual explanation for why the tsunami wave slows down the further it gets from the original earthquake source.
- Click here to add in the locations of some major cities in the Pacific basin.
- Rotate the globe and zoom in on each community in order to complete this table.
| Community | Estimated Time for Tsunami to Reach Community |
| Honolulu, Hawaii | a little over 8hr |
| Sydney, Australia | 11hr 30min |
| Auckland, New Zealand | 15hr |
| Anchorage, Alaska | 14hr 30min |
| Victoria, British Columbia | 10hr 20 min |
| Los Angeles, California | 11hr 10min |
| Acapulco, Mexico | 14hr 50min |
| Lima, Peru | 20hr 20min |