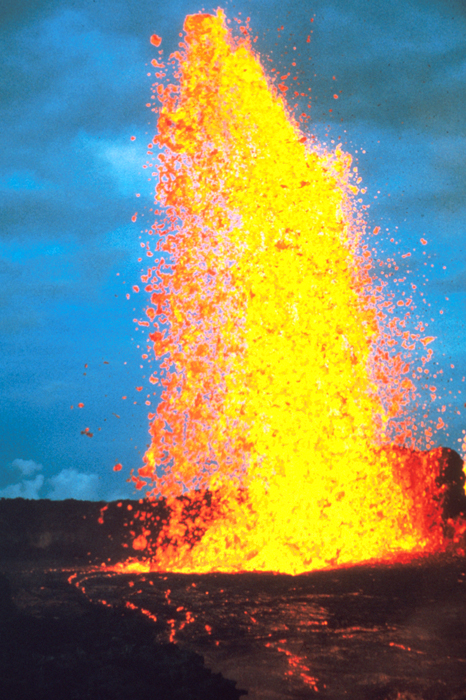
Some volcanoes form far from the edges of tectonic plates. These volcanoes form over what is called a hot spot. A hot spot is a plume of magma that remains stationary as a tectonic plate slowly moves above it. A volcano will form directly above the hot spot. Eventually this volcano will cease to be active as the drift of the tectonic plate slowly moves it away from the hot spot. A new volcano will form as new crust slowly moves over the hot spot. The Hawaiian Islands were formed by crust slowly drifting over a hot spot. This hot spot will be analyzed in detail in the accompanying Learning Activity.
The Canary Islands off the northwest coast of Africa is another example islands being formed over a hot spot.
 Illustration of how a hot spot formed the Hawaiian Islands. The Pacific plate slides over the fixed hotspot and over time a chain of islands is formed.
Learning Activity
Can we use the Hawaiian hot spot to analyze tectonic plate motion?
- Click here to carefully examine and identify the major islands and volcanoes that make up the Hawaiian Islands.
- The hot spot is currently under the eastern part of the big island of Hawaii. The Mauna Loa volcano, and particularly the Kilauea volcano are very active. Lo’ihi volcano, an underwater volcano off the eastern coast of Hawaii, is currently being formed as a result of this hot spot. Use the measuring tool to determine the distance from the volcano Kilauea on the big island of Hawaii to the following locations.
Location Distance from Kilauea (in kilometers) Maui (Haleakala) 178 West Maui 218 East Molokai 257 West Molokai 281 O’ahu (Ko’olau) 342 O’ahu (Wai’anae) 375 Kaua’i (Wai’ale’ale) 536
As we travel further northwest from the current location of the hot spot (we will use Kilauea as our current origin for the purposes of this exercise) the volcanic rock will get progressively older as a result of the drift of the Pacific plate over the Hawaiian hot spot. Here is a list of approximate ages that scientists have determined for some of these locations.
Location Age of Lava (x 106 years) Maui (Haleakala) 1.0 West Maui 1.3 East Molokai 1.8 West Molokai 1.9 O’ahu (Ko’olau) 2.6 O’ahu (Wai’anae) 3.7 Kaua’i (Wai’ale’ale) 5.1
Use the distance and age data to produce a graph of Distance (from Kilauea) vs. Time (Age of Lava) for the 7 island locations.
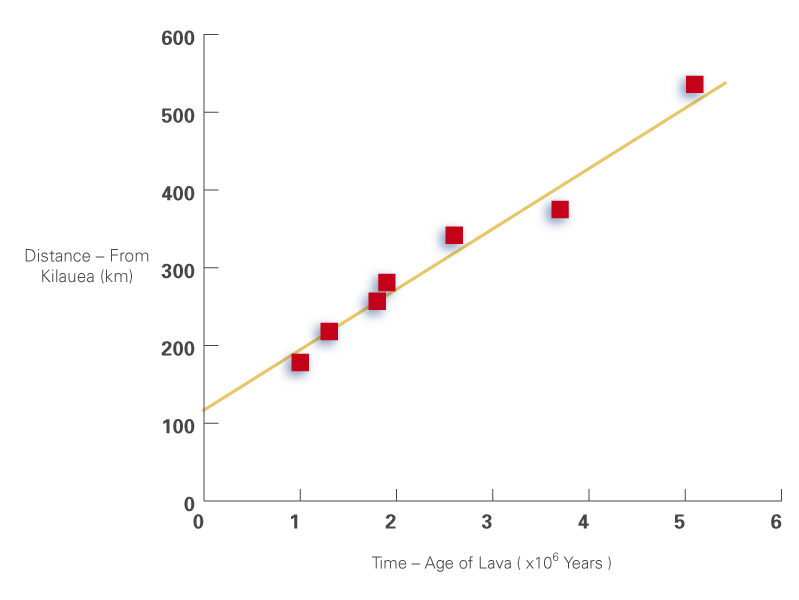 Your graph should be similar to this one.
- What does the slope of a position-time graph represent?
The slope of a position-time graph represents the average speed. - Calculate the slope of your position-time graph in units of mm/year. What is the average speed of the Pacific plate according to your calculation?
The slope using this data is 81 mm/year (accurate to 2 significant digits). This slope value represents the average speed of the Pacific plate over that range of time that our data points include. - The currently accepted value of the average speed of the Pacific plate is approximately 81 mm/year. How does your calculation in step 6 compare with this value? What are some possible sources of error that could account for some differences?
Our sample data lines up exactly with currently accepted values. Any differences would probably have been as a result of measurement error, or an estimation of exactly what point on the islands to measure the actual distance to from Kilauea. - A long series of underwater volcanoes known as the Hawaiian Ridge stretches northwest of the Hawaiian Islands. These volcanoes then continue north in what is known as the Emperor Seamount Chain. A seamount is a submerged mountain, usually formed by a volcano that rises at least 1 kilometer (0.6 miles) above the ocean floor. All of the structures in the Hawaiian-Emperor Chain are believed to have been formed by the same hot spot. These structures form an L-shape with the kink being between the Emperor Seamount Chain and the Hawaiian Ridge. What could have caused this kink?
Scientists theorize that the kink represents a change in direction for the motion of the Pacific plate. The Emperor Seamount Chain was formed as the plate was moving north. The plate then changed direction roughly moving northwest resulting in the Hawaiian Ridge and the current Hawaiian Islands. (The ages of volcanoes bracketing the bend suggest that this change in direction occurred approximately 43 million years ago.) - Below is a graph describing the entire Hawaiian-Emperor Chain. Use this graph to calculate the average speed of the Pacific plate (in mm/year) over the period of the formation of the entire Hawaiian-Emperor Chain. (Note: Carefully take note of the units and the axis labels.)
The average speed of the Pacific plate was 87 mm/year (2 significant digits).
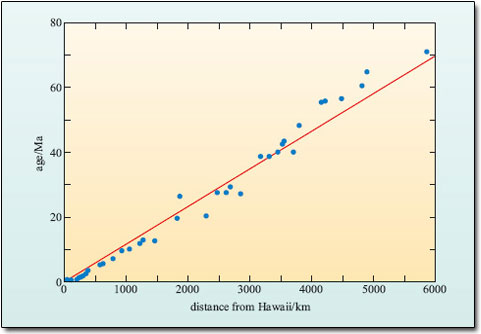 Data points covering the entire Hawaiian-Emperor Chain.
- Compare this value with the current value for the Pacific plate in the Hawaiian Islands. What does this tell about how the motion of the Pacific plate has changed over time? Does this seem reasonable to you?
The average value of 87 mm/year over the whole chain is slightly higher than the current value of 81 mm/year for the Hawaiian Islands. This means the plate changed speed and probably moved slightly faster in the past. This actually is not an unreasonable answer since a major event happened in the past that resulted in an actual change in plate direction. This same major event might also have affected the speed of the plate.