Glaciers also produce many unique landforms as a result of the deposition of material that has been picked up by a glacier as it moves. Some of these landforms include:
- Moraines: A moraine is a ridge-like accumulation of rocks and sediment that has been scraped together by the movement of a glacier.
 Several ridge-like moraines are visible in this glacier below Mt. McKinley (Denali), the largest mountain in North America.
- Eskers: An esker is a long, winding ridge made of sand and gravel. An esker is produced as a result of deposition in a stream that flows under the ice in a melting glacier.
 Eskers, such as the Dahlen Esker in North Dakota, are very recognizable from the air because of their long, winding ridge.
- Drumlins: A drumlin is an elongated, teardrop-shaped landform of glacial sediment. Drumlins lie parallel to the direction of glacier movement with a drumlin’s steeper side facing the direction from which the glacier originally came. The deposition that forms drumlins is thought to occur when glaciers travel either over bedrock obstacles, or over previous areas of deposition of material.
 A photo of a drumlin indicating its characteristic teardrop-shape as well as the direction of the glacier that formed the drumlin.
Esker: Esker is an 1848 word that is derived from the Irish (i.e., Gaelic) word eiscir which means ridge of gravel.
Drumlin: Drumlin is an 1833 word that is derived from the Irish (i.e., Gaelic) word druim which means hill.
Learning Activity: Latitude and Temperature
Continental glaciers only exist in the extreme north (i.e., Greenland) and in the extreme south (i.e., Antarctica). The probability of snow in December in San José, the capital of Costa Rica, is 0%, while the probability of snow at the same time much further north in Ottawa, the capital of Canada, is almost 100%. In this activity, you will investigate the reason for these discrepancies, and why average temperature is related to latitude.
- Click here to mark the position of the geographic North and South Poles.
- Click here to add in the lines of latitude and longitude.
- Click here to zoom in on the northern hemisphere.
Use the distance measuring tool to measure the distance (in km) on the Earth’s surface between 0° latitude (i.e., the equator) and 10°N latitude. Measure this distance on the outer edge of the globe. (Click here to see an example of this if you need help.)
Continue to measure the distance (in km) between adjacent latitude intervals. Enter your data in a table like the one below. (Remember to measure the distance for your latitude intervals on the outer edge of the globe.)
Prepare a bar chart of this data. Plot latitude interval on the horizontal axis, and interval distance (in km) on the vertical axis.
Individual values for the data table will vary because of the accuracy and care with which the measurements were taken. Your data, however, should show an increase in surface distance for each latitude interval. Your data should be similar to this:| Latitude Interval | Interval Distance (km) |
| 0–10° N | 1100.8 |
| 10–20° N | 1114.1 |
| 20–30° N | 1124.7 |
| 30–40° N | 1158.7 |
| 40–50° N | 1206.6 |
Here is the bar graph for this data table:
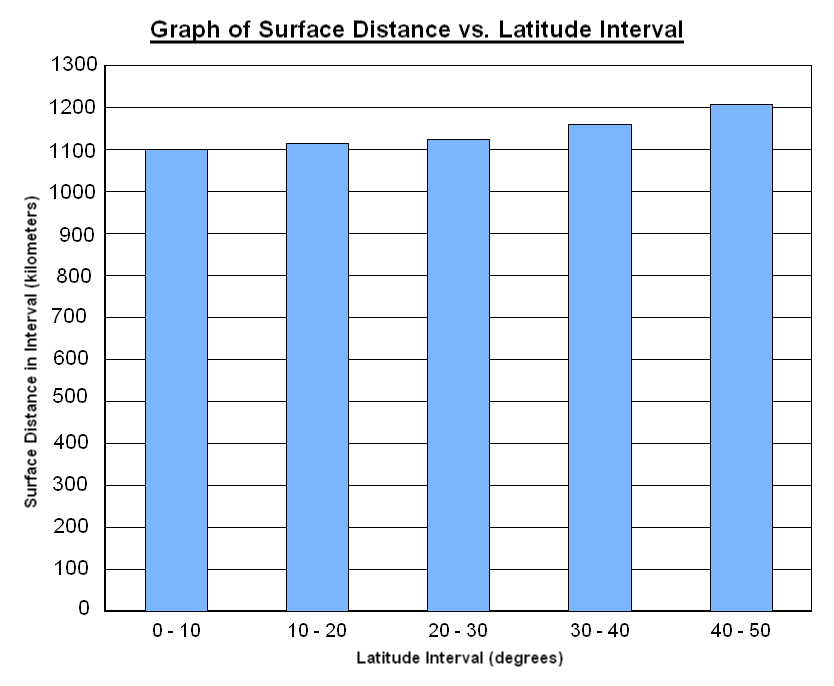 Graph of surface distance versus latitude interval.
- What happens to the distance between latitude intervals the further north you go? The distance between latitude intervals increases the farther north you go.
- What is causing this change in distance? This change in distance is caused by the curvature of the Earth.
- The Earth receives its surface energy from the sun. Do all parts of the Earth’s surface receive equal amounts of energy? Support your answer. No, all parts of the Earth’s surface do not receive equal amounts of energy. We know that the sun’s energy can’t be equally distributed because it gets much colder the farther away you get from equatorial regions. This is evidenced by the difference in winter snow between San José and Ottawa, and the existence of continental glaciers in Greenland (and Antarctica).
- Although your data does not extend to the north pole, how could your existing data allow you to account for the existence of continental glaciers only in the far north (i.e., Greenland)? The sun’s rays are spread over greater and greater areas the farther north you go. They would be spread over the greatest area in the far north. The temperature, as a result, is low enough that snow can exist on the ground year-round.
- Why does the average surface temperature generally decrease the farther north you get from the equator? Support your answer. The average surface temperature decreases with distance from the equator because the sun’s rays are spread over an increasing surface area the further north we get. This is caused by the curvature of the Earth. This conclusion is supported by our data which shows that the distance between the latitude interval consistently increases the further north you go.