Climate and the Rate of Chemical Weathering
Objective: The purpose of this activity is to analyze the rate of chemical weathering in two different parts of the world. You will also attempt to account for any observed differences in your analysis.
Materials Required: Everything that you need for this exercise is included in the on-screen components.
Time Required: approximately 45 minutes
One way to measure the rate of chemical weathering is by measuring the concentration of dissolved materials in water systems. Several materials are typically measured, but the concentration of sodium (Na) is a commonly used marker of chemical weathering. In this exercise, you will compare the rate of chemical weathering in the northeastern U.S. with that in Venezuela, South America. You will begin this exercise by examining data from two locations in the northeastern U.S.
- Click here to see the location of our two data points in the northeast U.S. (i.e., northern temperate climate)
Move your mouse over both locations to see the latitude for each location in the status bar at the bottom of the screen.
 Hubbard Brook is part of an ecological research zone in the Hubbard Brook Experimental Forest.
- What is the latitude for Panther Lake, New York, and Hubbard Brook, New Hampshire? Panther Lake has a latitude of 43.33° N, and Hubbard Brook has a latitude of 43.94° N
Use the measuring tool to determine the distance between Panther Lake and Hubbard Brook.
- What is the distance (in km) between Panther Lake and Hubbard Brook? The distance between Panther Lake and Hubbard Brook is approximately 344.4 kilometers.
Here is the chemical weathering data that has been collected for Panther Lake, New York and Hubbard Brook, New Hampshire.
| Panther Lake, New York | Hubbard Brook, New Hampshire | |
| Relative Concentration of Sodium (Na) (per hectare/per year) | 0.20 | 0.22 |
| Total Average Precipitation (mm/year) | 1210 | 1250 |
-
- Does the data reveal a great difference in the rate of chemical weathering between Panther Lake and Hubbard Brook? No, there is very little difference in the data between these two locations.
- Why do you think that this is so? They are very close geographically to one another; they are only about 344 kilometers apart from one another. Another possible reason might be that they are almost on the same latitude. The main reason is that they both share similar total average precipitation values.
- Click here to see the location of our two data points in Venezuela, South America. (i.e., tropical climate).
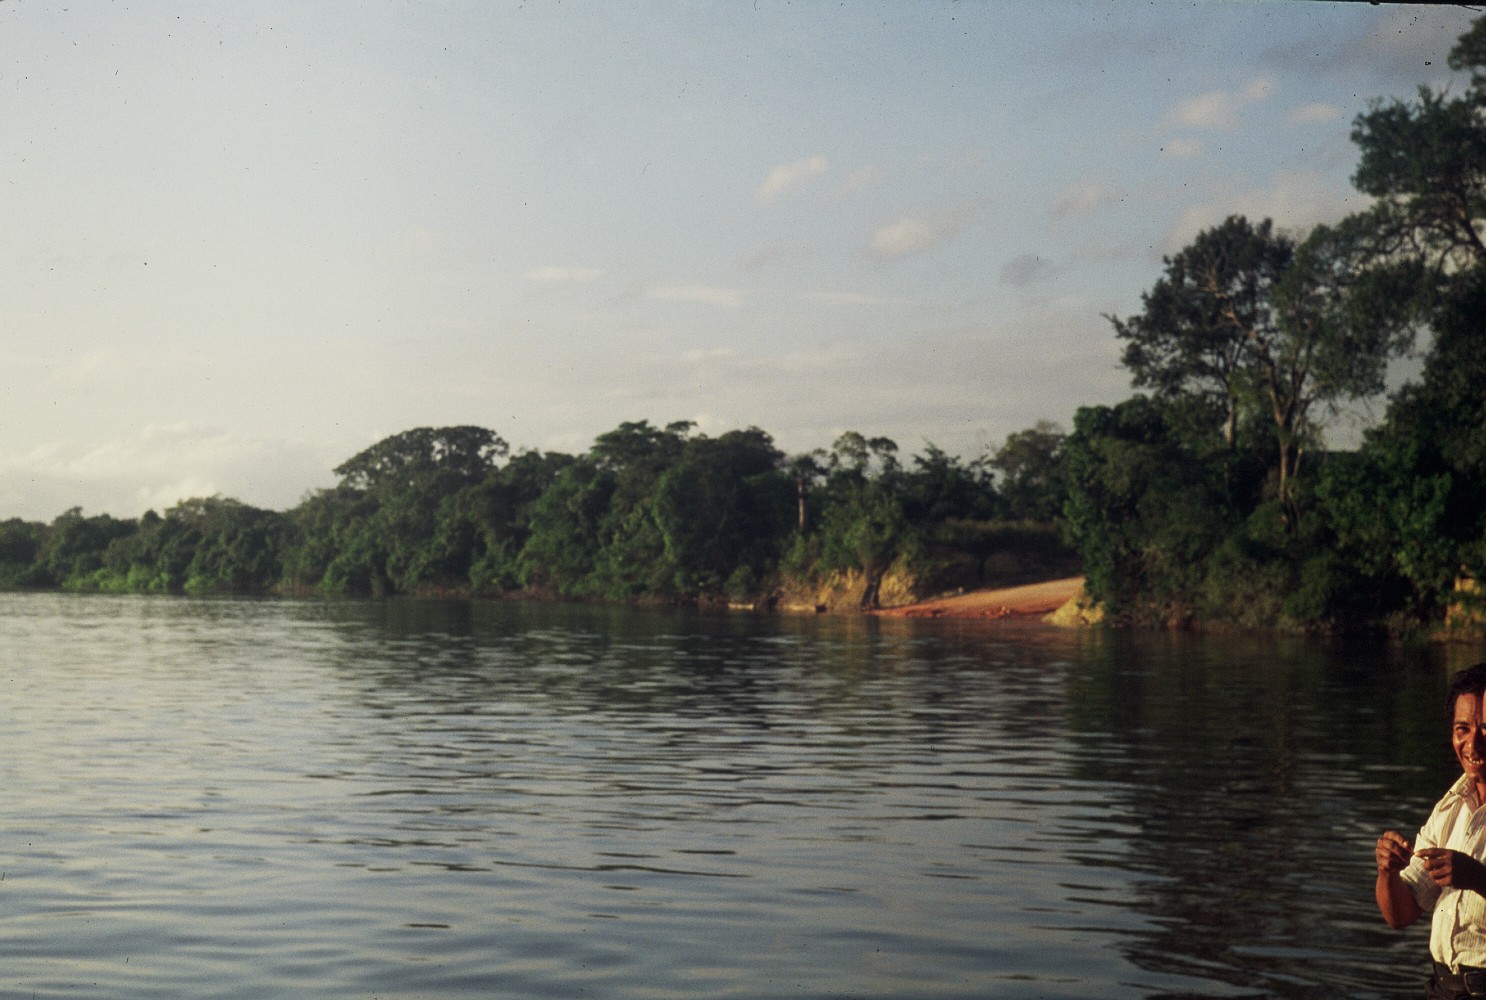 The Caura River is a tributary of the Orinoco River, the second longest river in South America.
Move your mouse over both locations to see the latitude for each location.
- What is the latitude for the indicated locations of the Caura River and the Apure River, both in Venezuela? The Caura River has a latitude of 6.29° N, and the Apure River has a latitude of 7.27° N.
Use the measuring tool to determine the distance between the Caura River and the Apure River.
- What is the distance (in km) between the Caura River and the Apure River? The Caura River and the Apure River are approximately 698.5 kilometers apart.
Here is the chemical weathering data that has been collected for the Caura River, Venezuela and the Apure River, Venezuela.
| Caura River, Venezuela | Apure River, Venezuela | |
| Relative Concentration of Sodium (Na) (per hectare/per year) | 1.20 | 0.89 |
| Total Average Precipitation (mm/year) | 4000 | 2180 |
-
- Is there a great difference between your data for the Caura River and the Apure River? There is a fair difference in the relative concentration of Na for the Caura River and for the Apure River.
- Why do you think that this is so? There may be several reasons for this difference. The distance between the two data locations in this tropical area is twice the distance between the data locations in the northeastern United States. This increases the chance of there being a regional variation in climate. Also, the two river locations are about 1° apart in latitude; further apart than the northern climate stations that were 0.61° apart. This, again, may account for a slight regional difference in the data. Together, both the increase in distance and the slight increase in latitude may have been a factor in accounting for the difference in the relative concentration of Na for our two data locations. The biggest factor influencing the difference in data values, however, is probably the large difference in total annual precipitation. The Caura River area has a much larger annual precipitation than the Apure River area. This is reflected in the larger relative concentration of Na in the Caura River.
-
- Does the data from our four experimental areas support a link between rate of chemical weathering and precipitation? Yes, there appears to be a clear link between precipitation and rate of chemical weathering.
- What kind of link does the data appear to support? Explain. There appears to be a direct relationship between total average annual precipitation and rate of chemical weathering. All four data locations clearly show that an increase in the total annual precipitation is accompanied by an increase in the relative concentration of Na.
-
- Does the data show a large difference in the rate of chemical weathering between a northern temperate climate (i.e., the northeastern U.S.) and a tropical climate (i.e., Venezuela)? Yes, the data clearly indicates a large difference in the rate of chemical weathering between our two climate zones.
- Which of these two climates has the greater rate of chemical weathering? The tropical climate zone (i.e., Venezuela) clearly has the greater rate of chemical weathering as revealed by the relative concentration of Na.
-
- What other major environmental factor might also contribute to the large difference in chemical weathering rates between the northeastern U.S. and the two river systems in Venezuela? Another major environmental factor is probably the average temperature of our data locations.
- How might the physical location of the four data points support your previous answer? Physical location, as determined by latitude, would have a great influence on the average annual temperature. Locations with a higher latitude, like our two northeastern U.S. points, would have a lower average annual temperature than locations with a lower latitude, like the two Venezuela points. The lower annual temperature would contribute to a lower rate of chemical weathering.